Historical coverage report
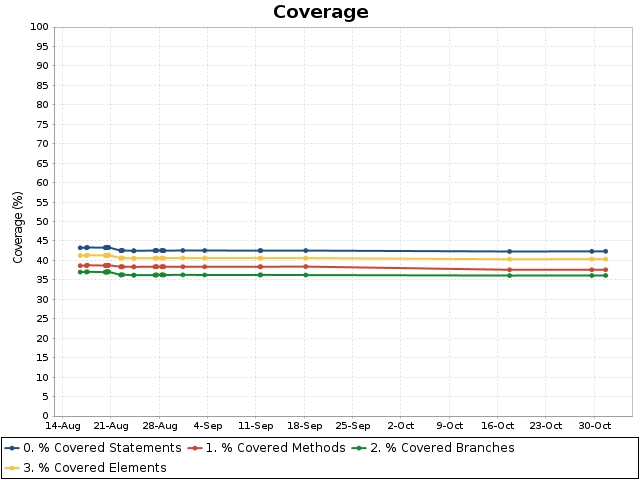
Coverage overview
| |
Conditionals |
Statements |
Methods |
TOTAL |
|
Project
|
36.1% |
42.4% |
37.6% |
|
Added classes
Table shows classes which have been added over the last 2 days.
Actual interval (based on timestamps of history points) is 2 days.
Showing maximum 5 classes.
Metric used: % TOTAL Coverage, max value is 100.
Changed classes
Table shows classes for which metric has changed (increased or decreased) above the threshold
(+/-1) over the last 2 days.
Actual interval (based on timestamps of history points) is 2 days.
Showing maximum 5 classes.
Metric used: % TOTAL Coverage, max value is 100.
Gainers
Losers
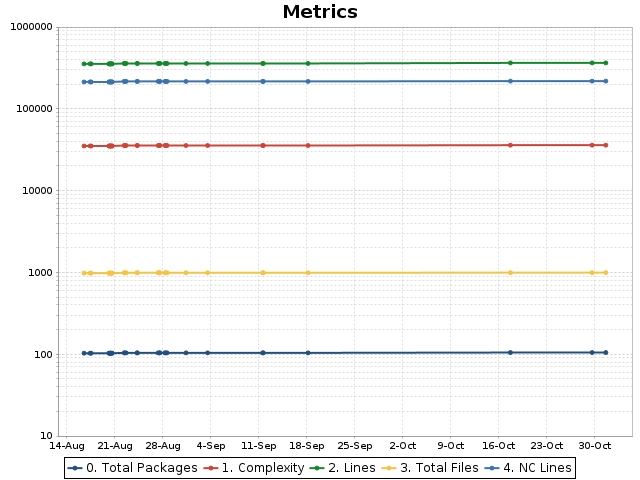
Charts